8 Synthetic Aperture Radar (SAR)
8.1 Summary
8.1.1 Overview
Synthetic Aperture Radar is an active sensor that actively transmits electromagnetic waves and captures the reflected waves to observe the land covers of the earth.
Unlike optical imagery which is passive imagery, SAR data can detect surface characteristics in different ways, by utilising the difference in polarisation and phase in the transmission and receiving signals. This also means observations are possible during nighttime and through clouds - leading to a more consistent observation independent of the conditions that may affect optical imagery observations.
Synthetic refers to the way waves are detected. Spatial resolution correlates with the size of the antenna, but since it was not practical to have a large-size antenna in space, the movement of the satellite was utilised to emulate a longer antenna.
8.1.2 Polarisation
Polarisation is the orientation of the electromagnetic fields in relation to the direction of the wave - this can be classified as either horizontal or vertical.
Video illustration of electromagnetic waves. Video sourced from NASA’s Scientific Visualisation Studio (2017)
A SAR satellite can transmit and receive horizontal and vertical waves. The four combinations of transmission and reception possible as follows:
- VV: Vertical transmission, Vertical reception
- VH: Vertical transmission, Horizontal reception
- HV: Horizontal transmission, Vertical reception
- HH: Horizontal transmission, Horizontal reception
HV and VH - those with different orientation for transmission and reception are called cross-polarised reflectance.
Different land covers reflect them in different behaviours - this enables us to identify the land covers.
| Type | Explanation | Scattering Strength |
|---|---|---|
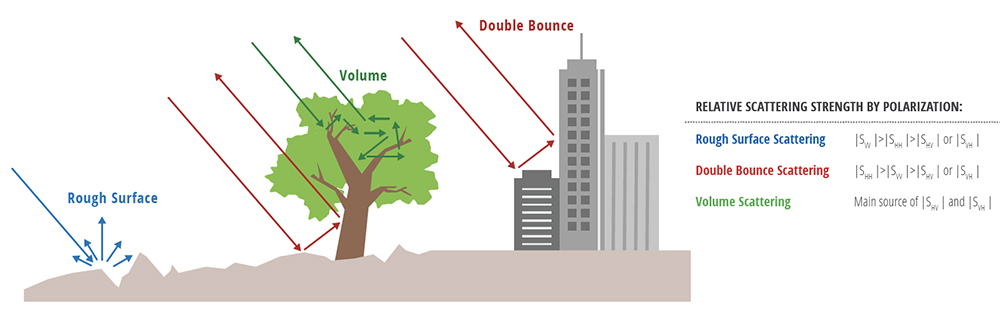
| Rough surface scattering | Reflection from bare soil or water - most sensitive to VV | \(|S_{VV}| > |S_{HH}| > |S_{VH}|, |S_{HV}|\) |
| Double bounce scattering | Reflection caused by buildings or standing structures, bouncing twice on the ground and an upright surface - most sensitive to HH | \(|S_{HH}| > |S_{VV}| > |S_{VH}|, |S_{HV}|\) |
| Volume scattering | Reflections from leaves or forest canopy - most sensitive to VH or HV | \(|S_{VH}|, |S_{HV}| > |S_{VV}|, |S_{HH}|\) |
The different types of reflections are illustrated below.
One extra point to note is that the wavelength also affects the reflection. A shorter wavelengths will be easily scattered by top layers of surface cover, while the longer wavelengths are capable to penetrate through. If observing forest canopy, longer bands might penetrate the leaves onto the ground, leading in more double bounce scattering than shorter wavelengths returning volume scattering.
8.1.3 Interferometry
Interferometry is a field of SAR imagery analysis making use of the difference in phases between observations - detecting changes in the distance between the satellite and the reflecting surface. If observations from the same orbital position received had different phases, this indicates there is a change in the position of the surface. This can be detected in the same magnitude as the wavelengths - a few centimeters’ change is enough to be able to be detected by SAR imagery. This is pretty wild - a slight difference in the surface can be detected from a satellite travelling at tremendous speeds some hundred kilometers away.
In the Google Earth Engine dataset, the phase data is not recorded - so we must use other tools to explore this feature.
8.2 Applications
One of the major applications of SAR is flood detection, because of the signature low backscatter of water surfaces. Kwak, Yun, and Iwami (2017) explored the use of SAR data to create an improved algorithm for flood detection, taking the 2015 flooding of River Kinu in Japan as a case study. The flooding in urban areas are difficult to detect than in the rural areas, because of the high density of buildings and other artifacts. They have created an algorithm that incorporates the orientation of the building in question - which led to a better outcome in detecting flooded buildings. One potential limitation of this study is that it only takes one image before and after the flooding event - any temporary changes in the environment may affect the results of change detection; a better practice would have been to use multiple imageries before the disaster to normalise the conditions first.
An application using the interferometry of SAR is the analysis of landslides, as conducted by Squarzoni et al. (2020). The issue with identifying changes in sparcely inhabited areas is that the lack of (unmoving) artificial objects make it difficult to identify the changes, and the impact of changing vegetation or snow cover leads to decorrelation, or inconsistency between different observations. This research has overcome these difficulties using correction techniques, and have successfully analysed the slow-moving landslides in the Apennines.
Both of these research addresses difficulties when analysing SAR imagery. In order to maximise the information achievable from SAR imagery, many methods of correction and calibration must be considered. One thing to note however, is that even these users of cutting-edge techniques do not take multiple before-event images to compensate for temporary changes - whether it be lack of valid data or failure of consideration, I feel it is important to follow the basic procedures when conducting research.
8.3 Reflection
Synthetic Aperture Radar being an active radar has many different characteristics compared to optical earth observations, which I feel adds a different layer to the world of remote sensing.
The part that surprised me the most is the fact that you can identify mere centimeters of terrain change from a satellite! The first application that came to my mind was the detection of earthquakes and disasters - a field that I feel remote sensing can play a vital role when it comes to immediate information collection. The Japanese earthquake that happened just before I started this module is still a big issue, and I am not surprised to see a lot of work using SAR data around the affected areas.
As a wrap-up of the whole module where I have been exposed to the whole new world of earth observation data, I am fascinated by the tremendous amount of data that is collected and available for analysis for the whole globe. Have been doing planning, civil engineering and a bit of policy making and international affairs related stuff for quite some time now, but never have I seen any inputs from this field - this may just be confessing how unaware I was, but at the same time I feel we are not getting the most out of this to inform decisions. Hope to bridge this gap in my future career!